Latitude Visualizations
Overview
Visualization and dashboard layer for Latitude, a next-generation canvas-based BI tool for exploring and analyzing data.
Context
We developed a new BI tool to explore data using SQL and other more visual and friendly blocks for people without SQL knowledge. But what was missing was a way to visualize the data in a way that was easy to understand and share with other company members or customers.
Problem
We had the first version of visualizations, but it was quite limited, the initial chart library didn't have a great variety of charts and the customization was quite limited.
The first version of dashboards was a square grid with no hierarchy of rows and columns, which resulted in poor responsiveness.
Some of our users wanted to make their dashboard available to their customers in their products. But they had to create one dashboard per client and the customization was quite limited.
Opportunity
We didn't have enough product surface to compete with other BI tools, so we had to not only match the features of the competition, but offer something different.
Some of the users also asked for a way to share their dashboards with their clients in a more customizable way. This is what they would need to start paying for the product.
Research
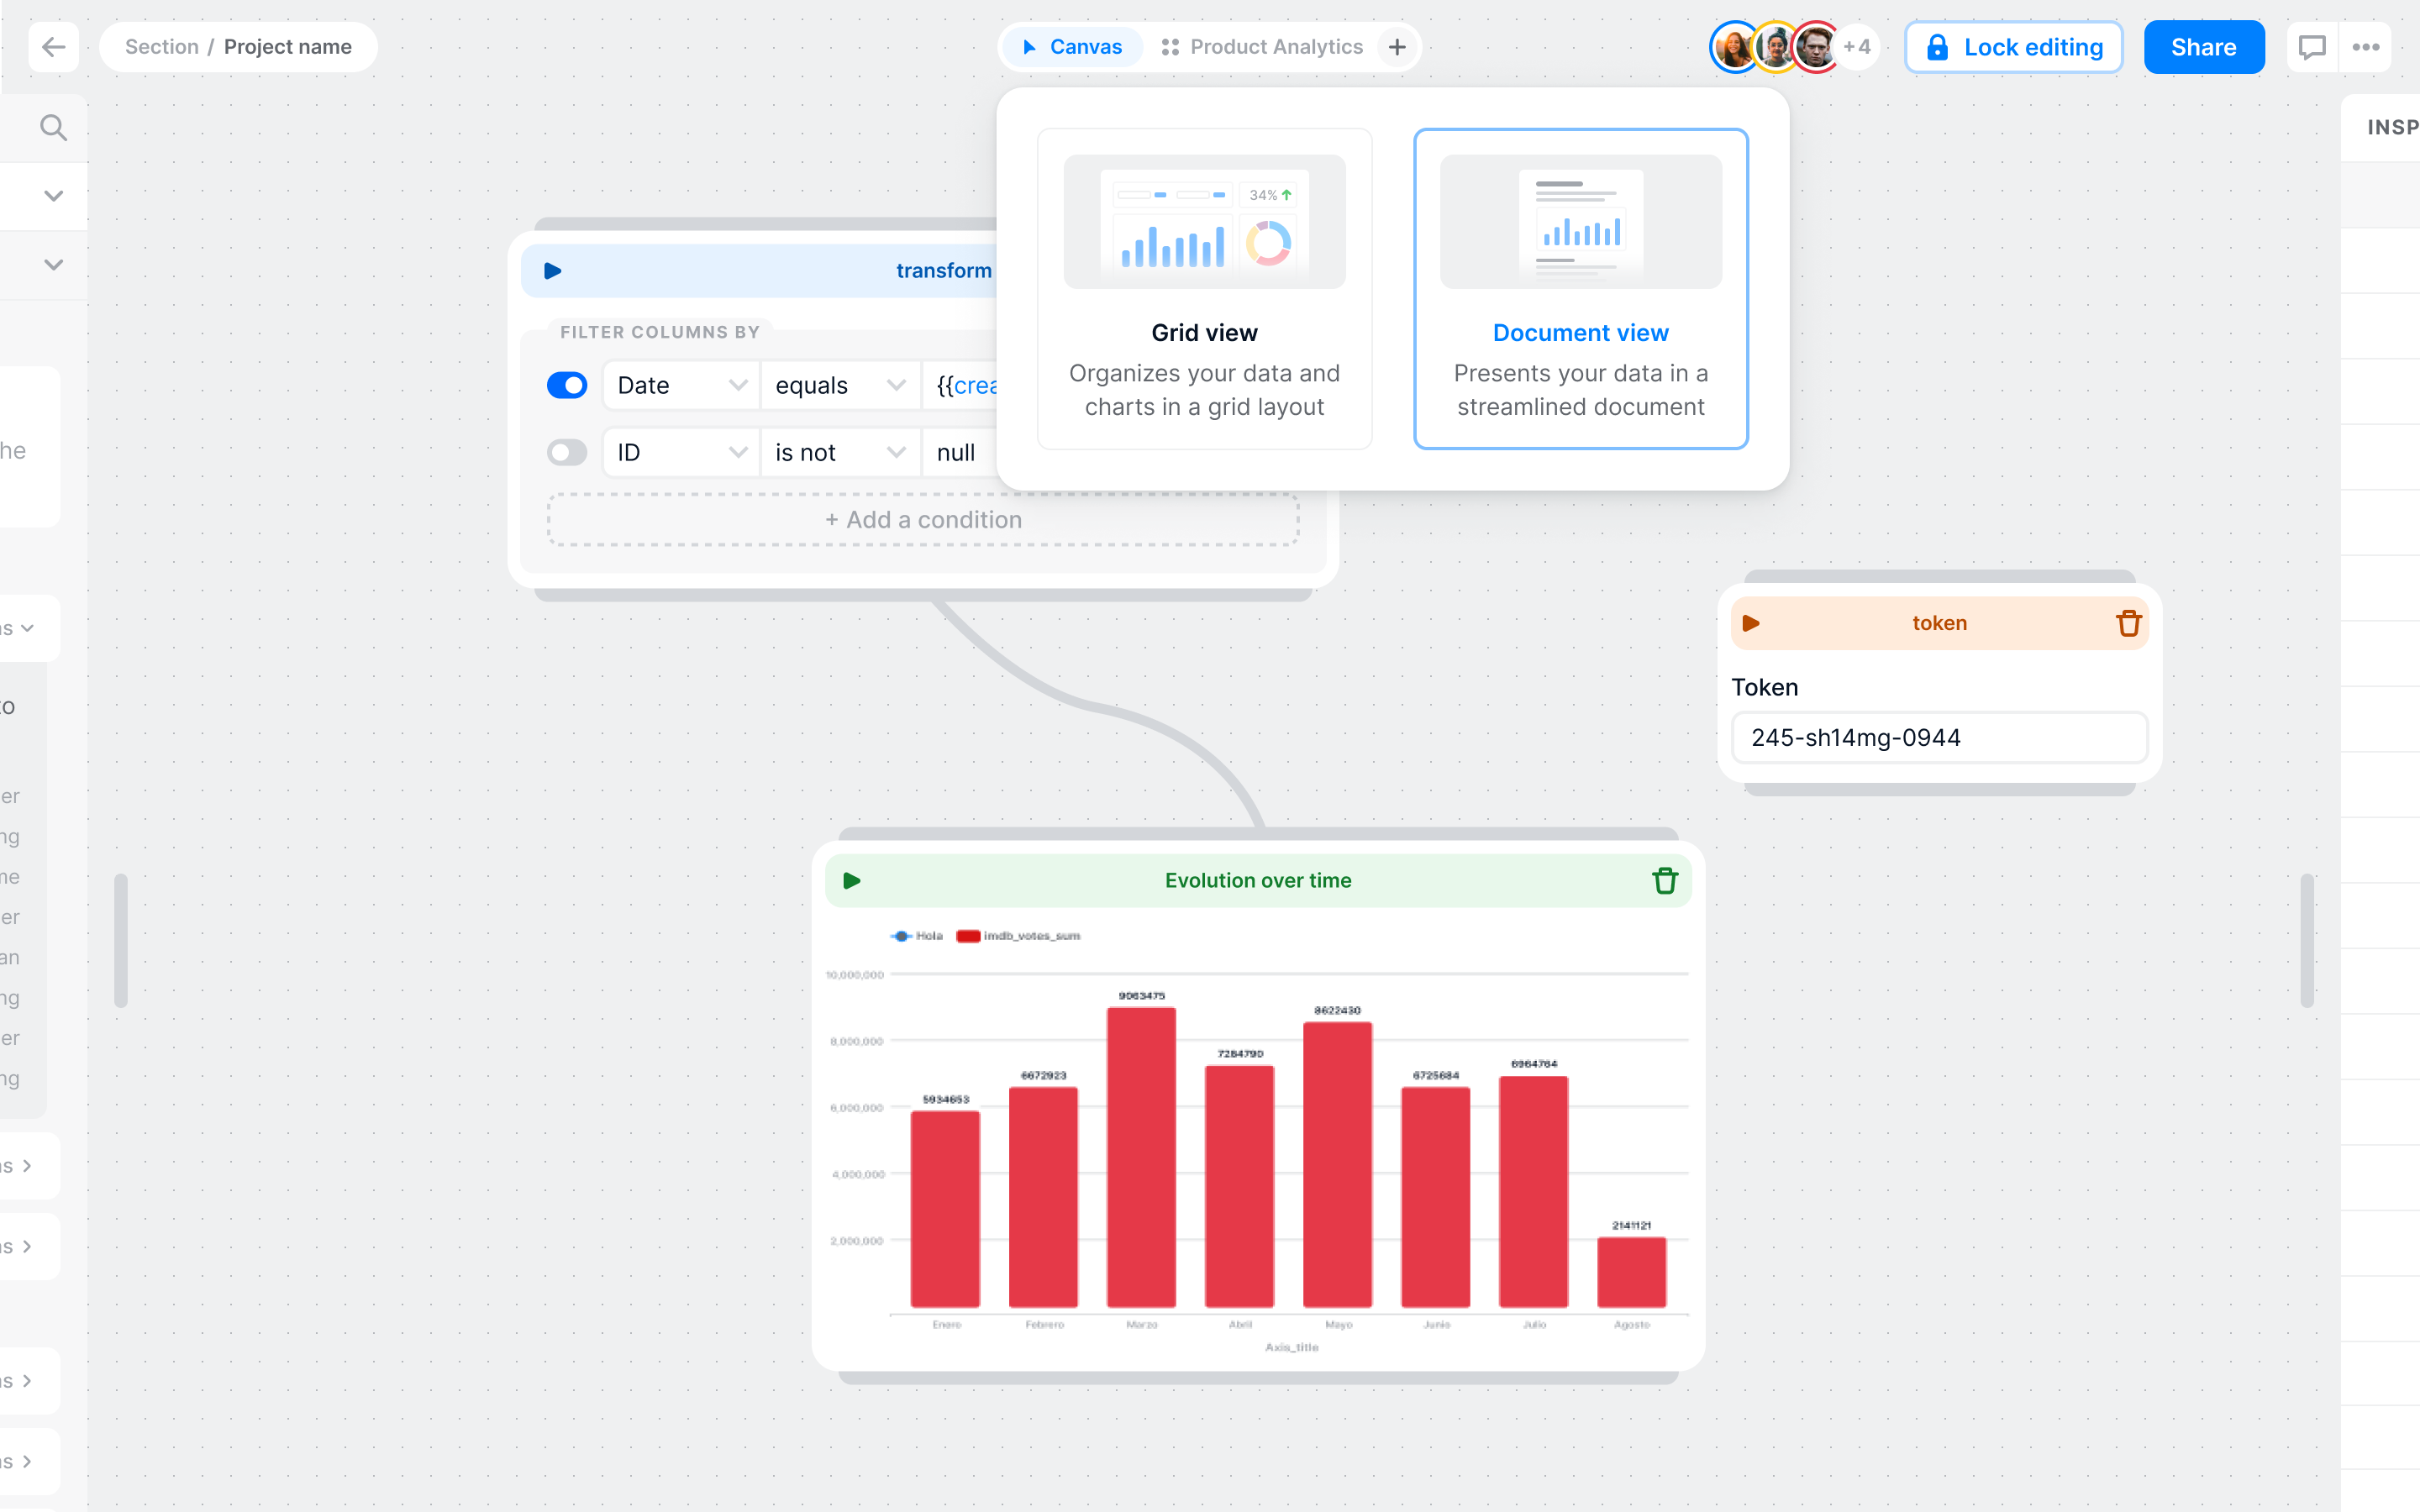
Talking to some users, they saw value in the canvas model for exploring data, but some transformations, even with visual blocks, were difficult for some stakeholders to understand.
We found that most stakeholders only wanted to interact with the end result, the charts and dashboards.
Also, a dashboard builder with a hierarchy of rows and columns was a must because users wanted to embed the dashboard into their products and we don't control the width available.
In addition to the responsive problem, we needed to filter the same dashboard for different clients to avoid creating one view per client.
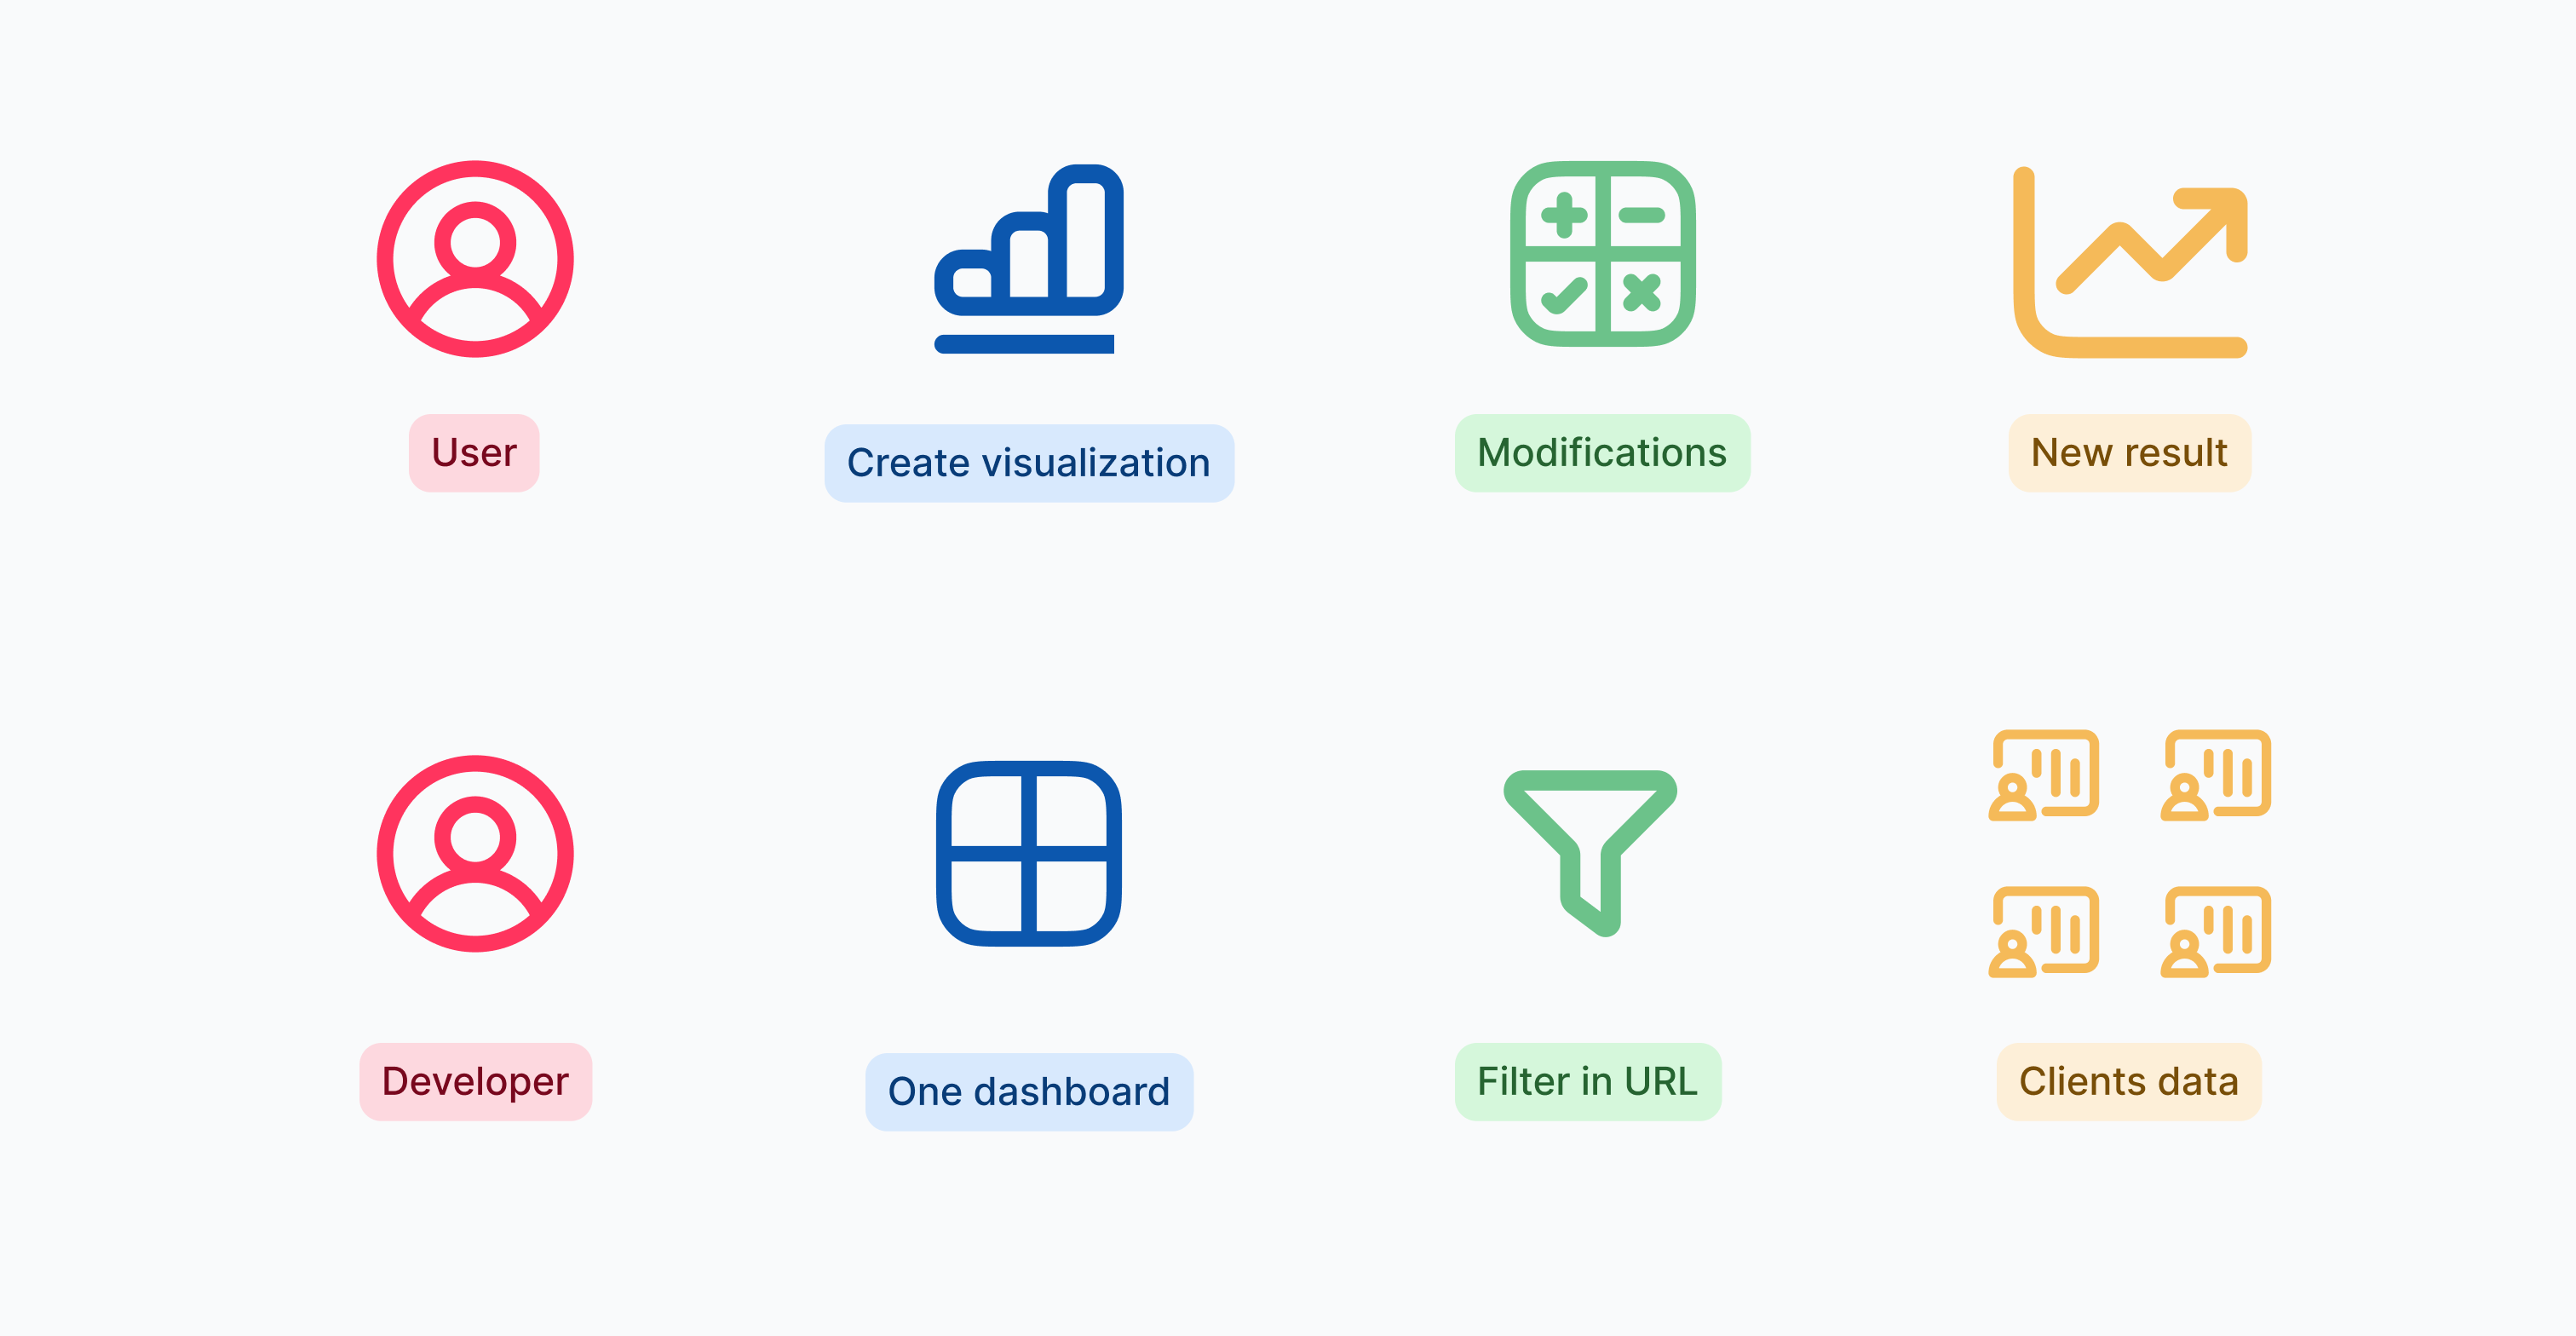
Key User tasks
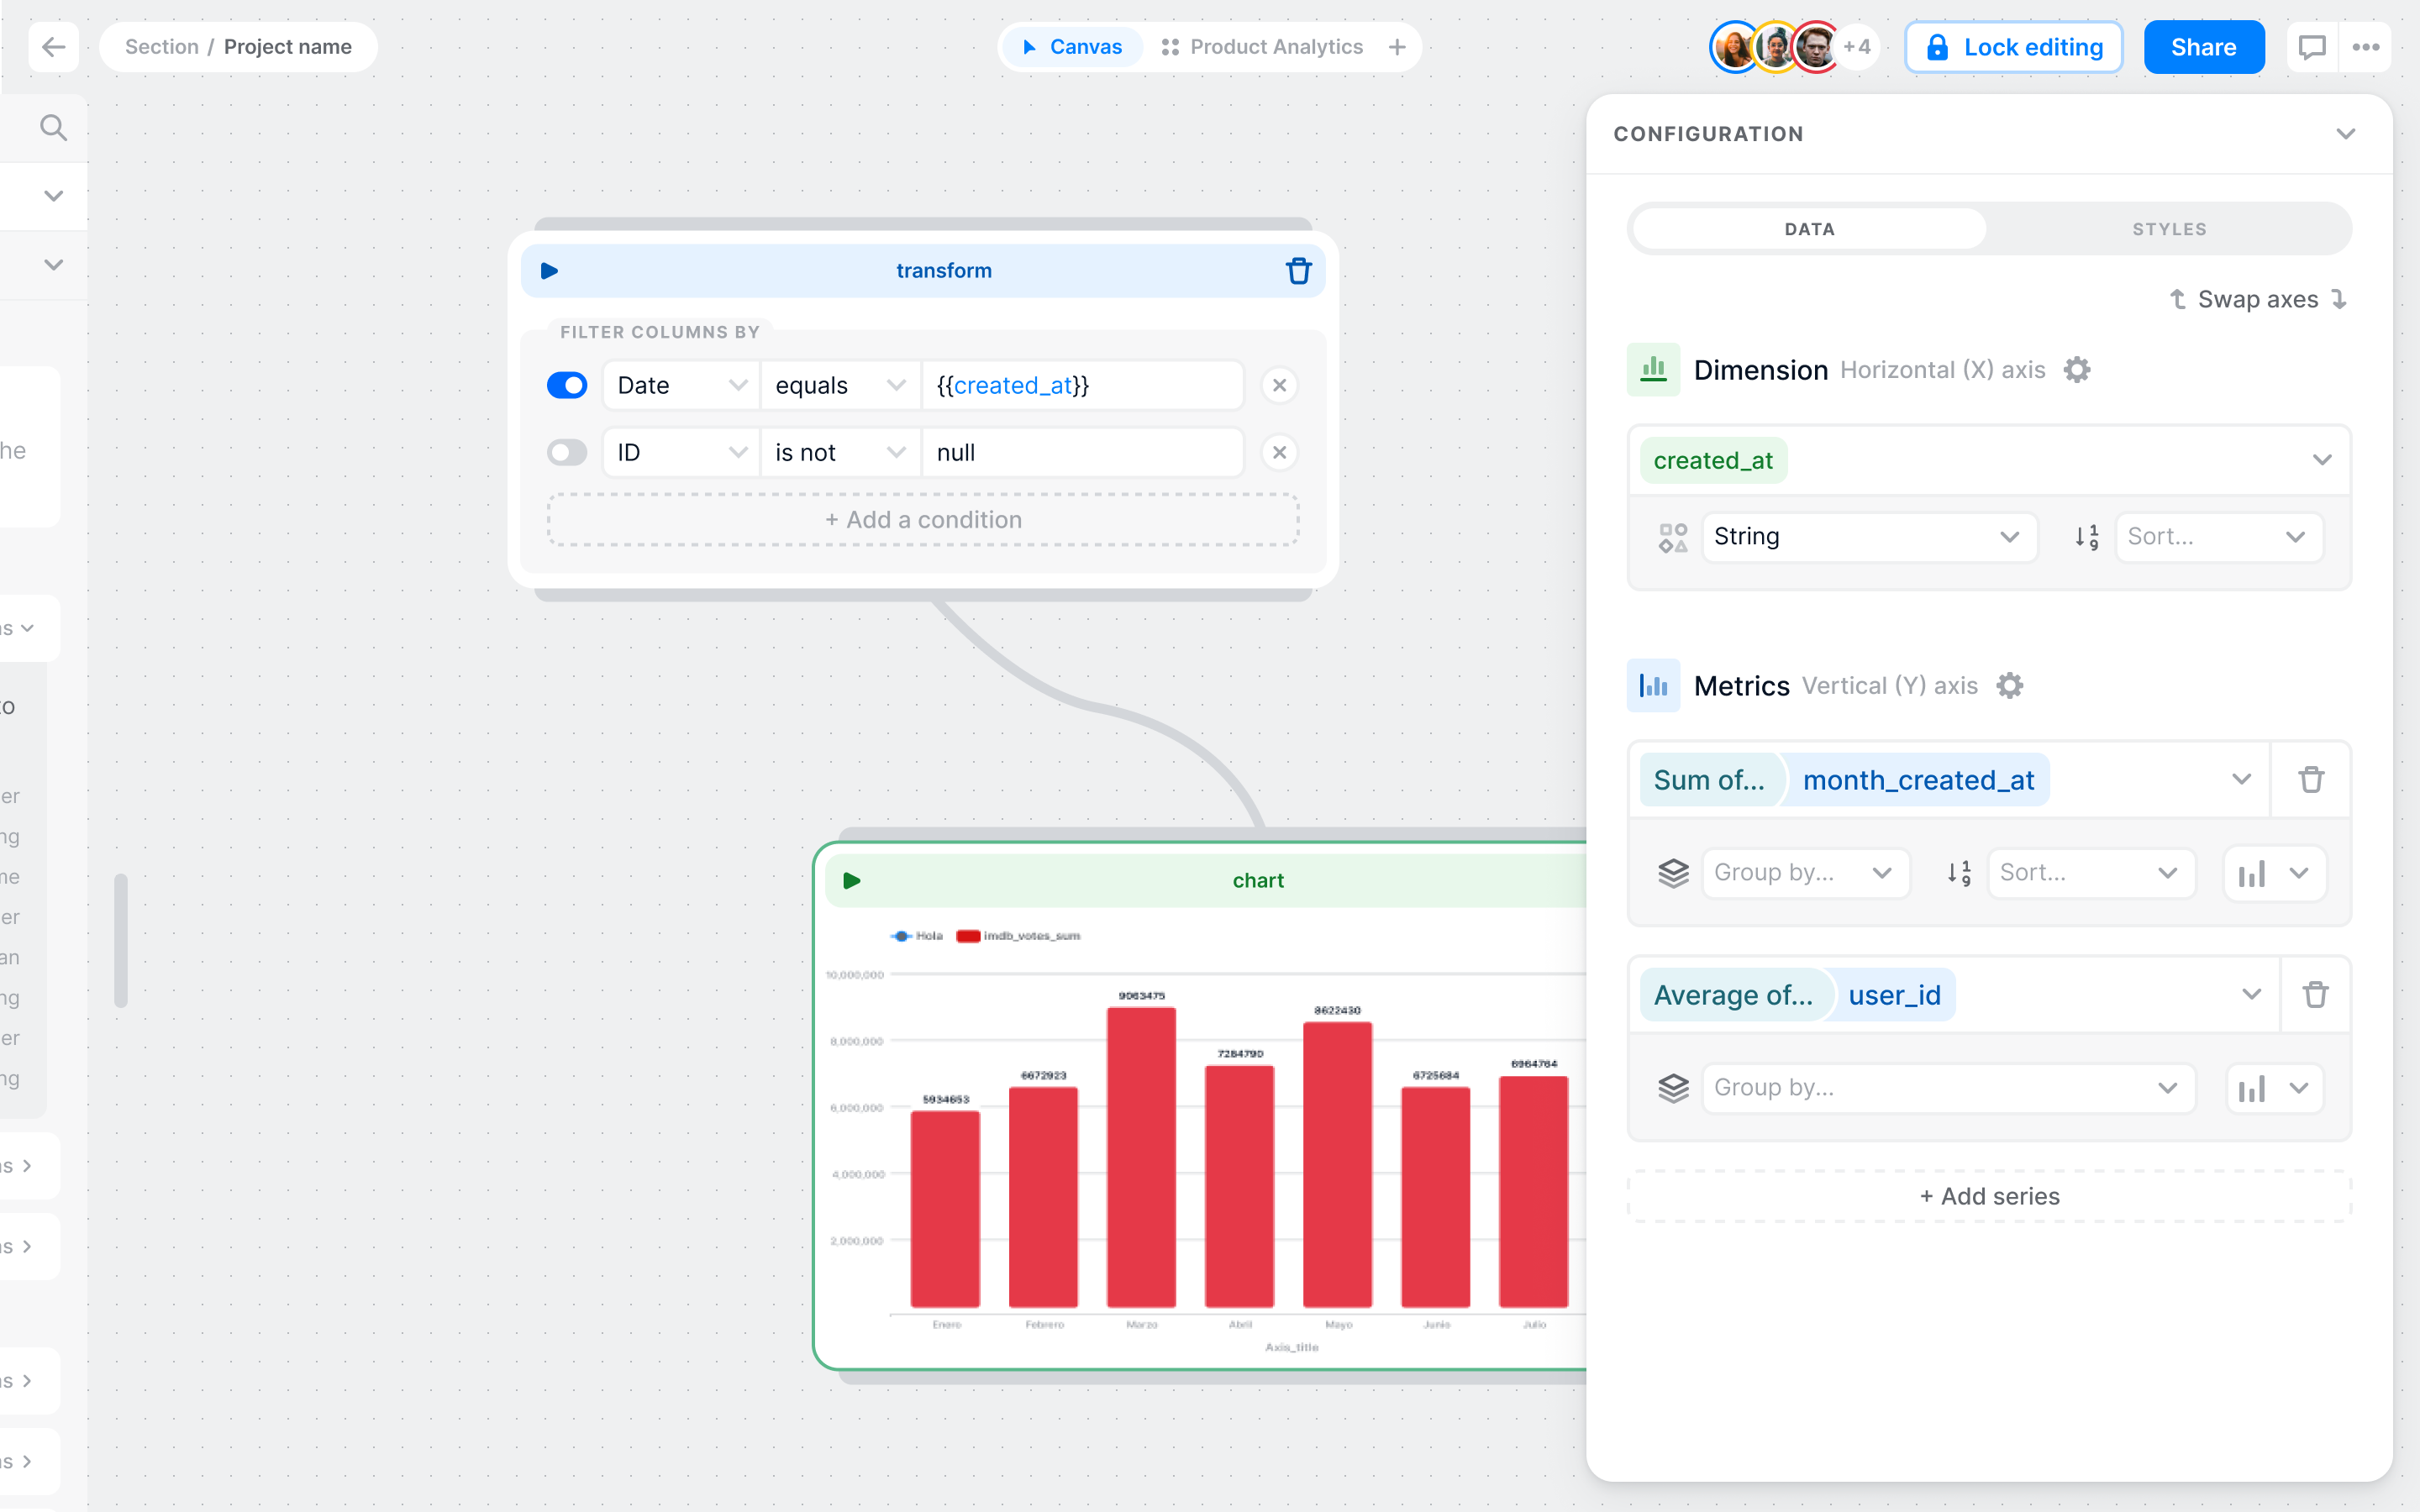
As a stakeholder, I want to modify the visualizations so that I can get the result I need without writing SQL.
As a developer, I want an easy way to filter the same dashboard for different clients so that I can safely embed the dashboard in my product.
As a data analyst, I want to create different types of visualizations and fully customizable so that I can present the data in a more understandable way.
Solution
There are 3 phases to this project: 1. Implement a new library of charts and improve the usability and customization of the charts. 2. Implement a dashboard builder with a hierarchy of rows and columns. 3. Implement a way to filter the same dashboard for different clients using URL params.
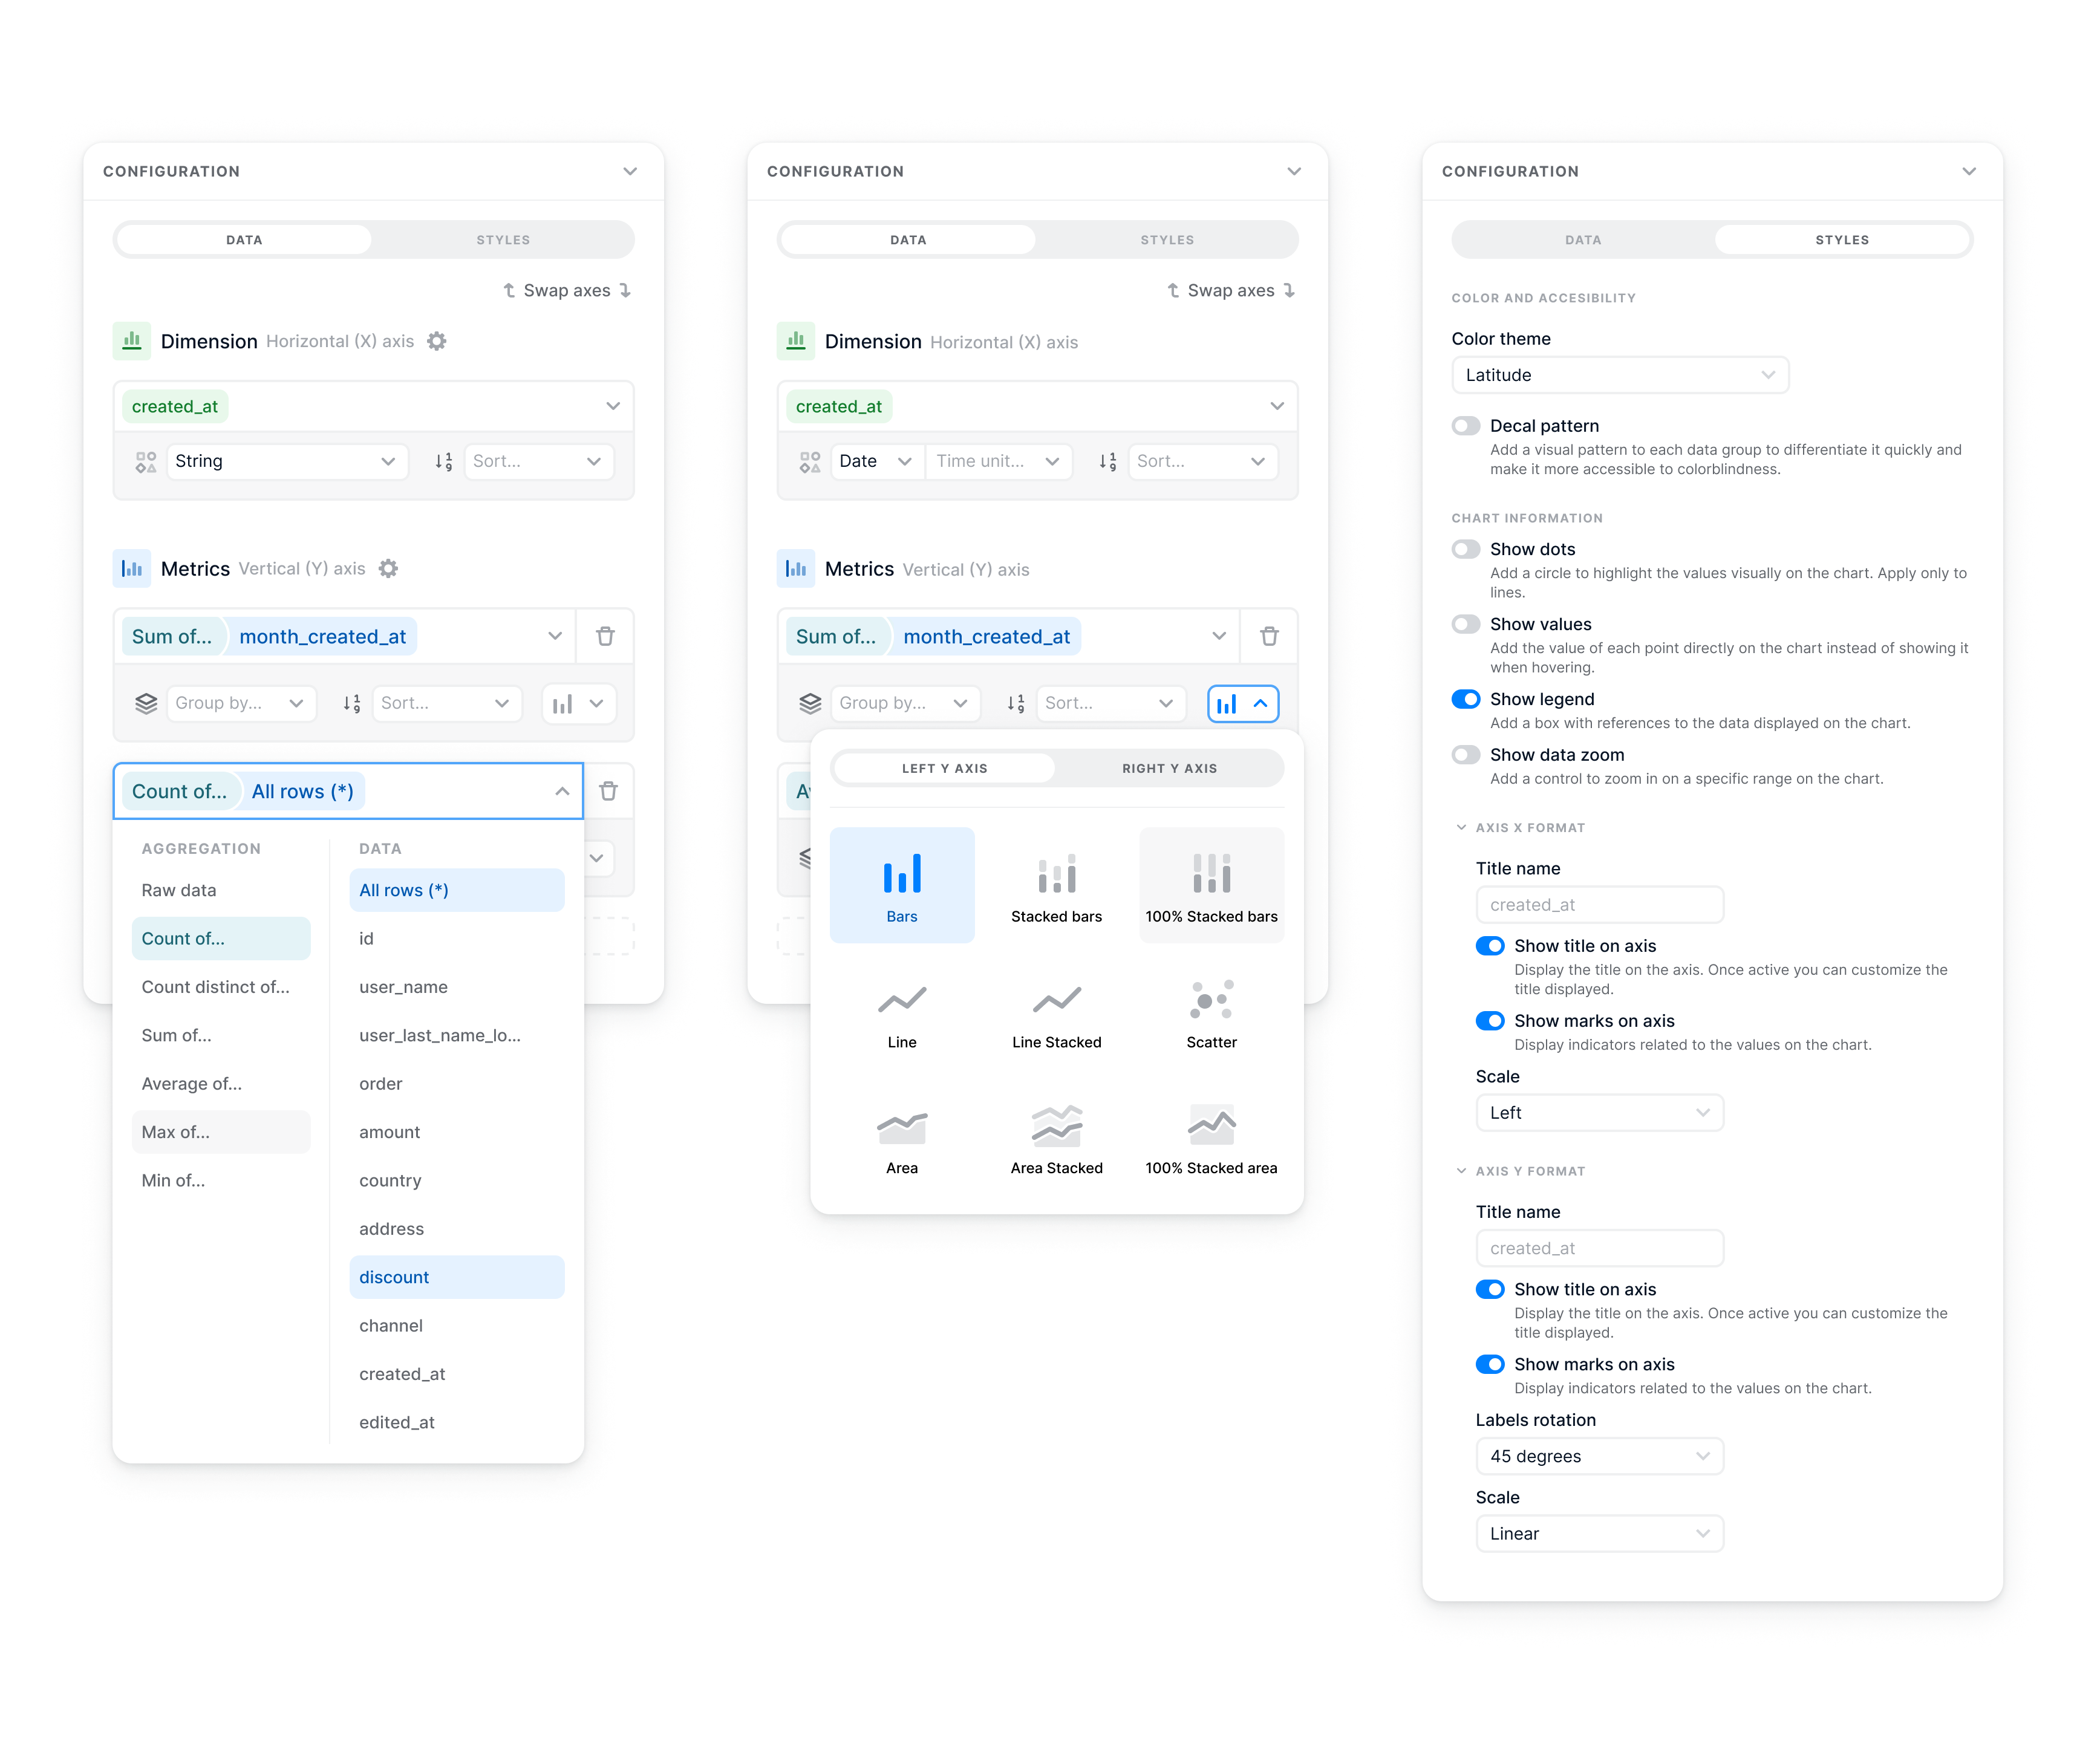
We implemented the eCharts library because it offers a ton of visualization types out of the box. We improved the way to interact with charts to allow stakeholders to play with them without writing SQL.
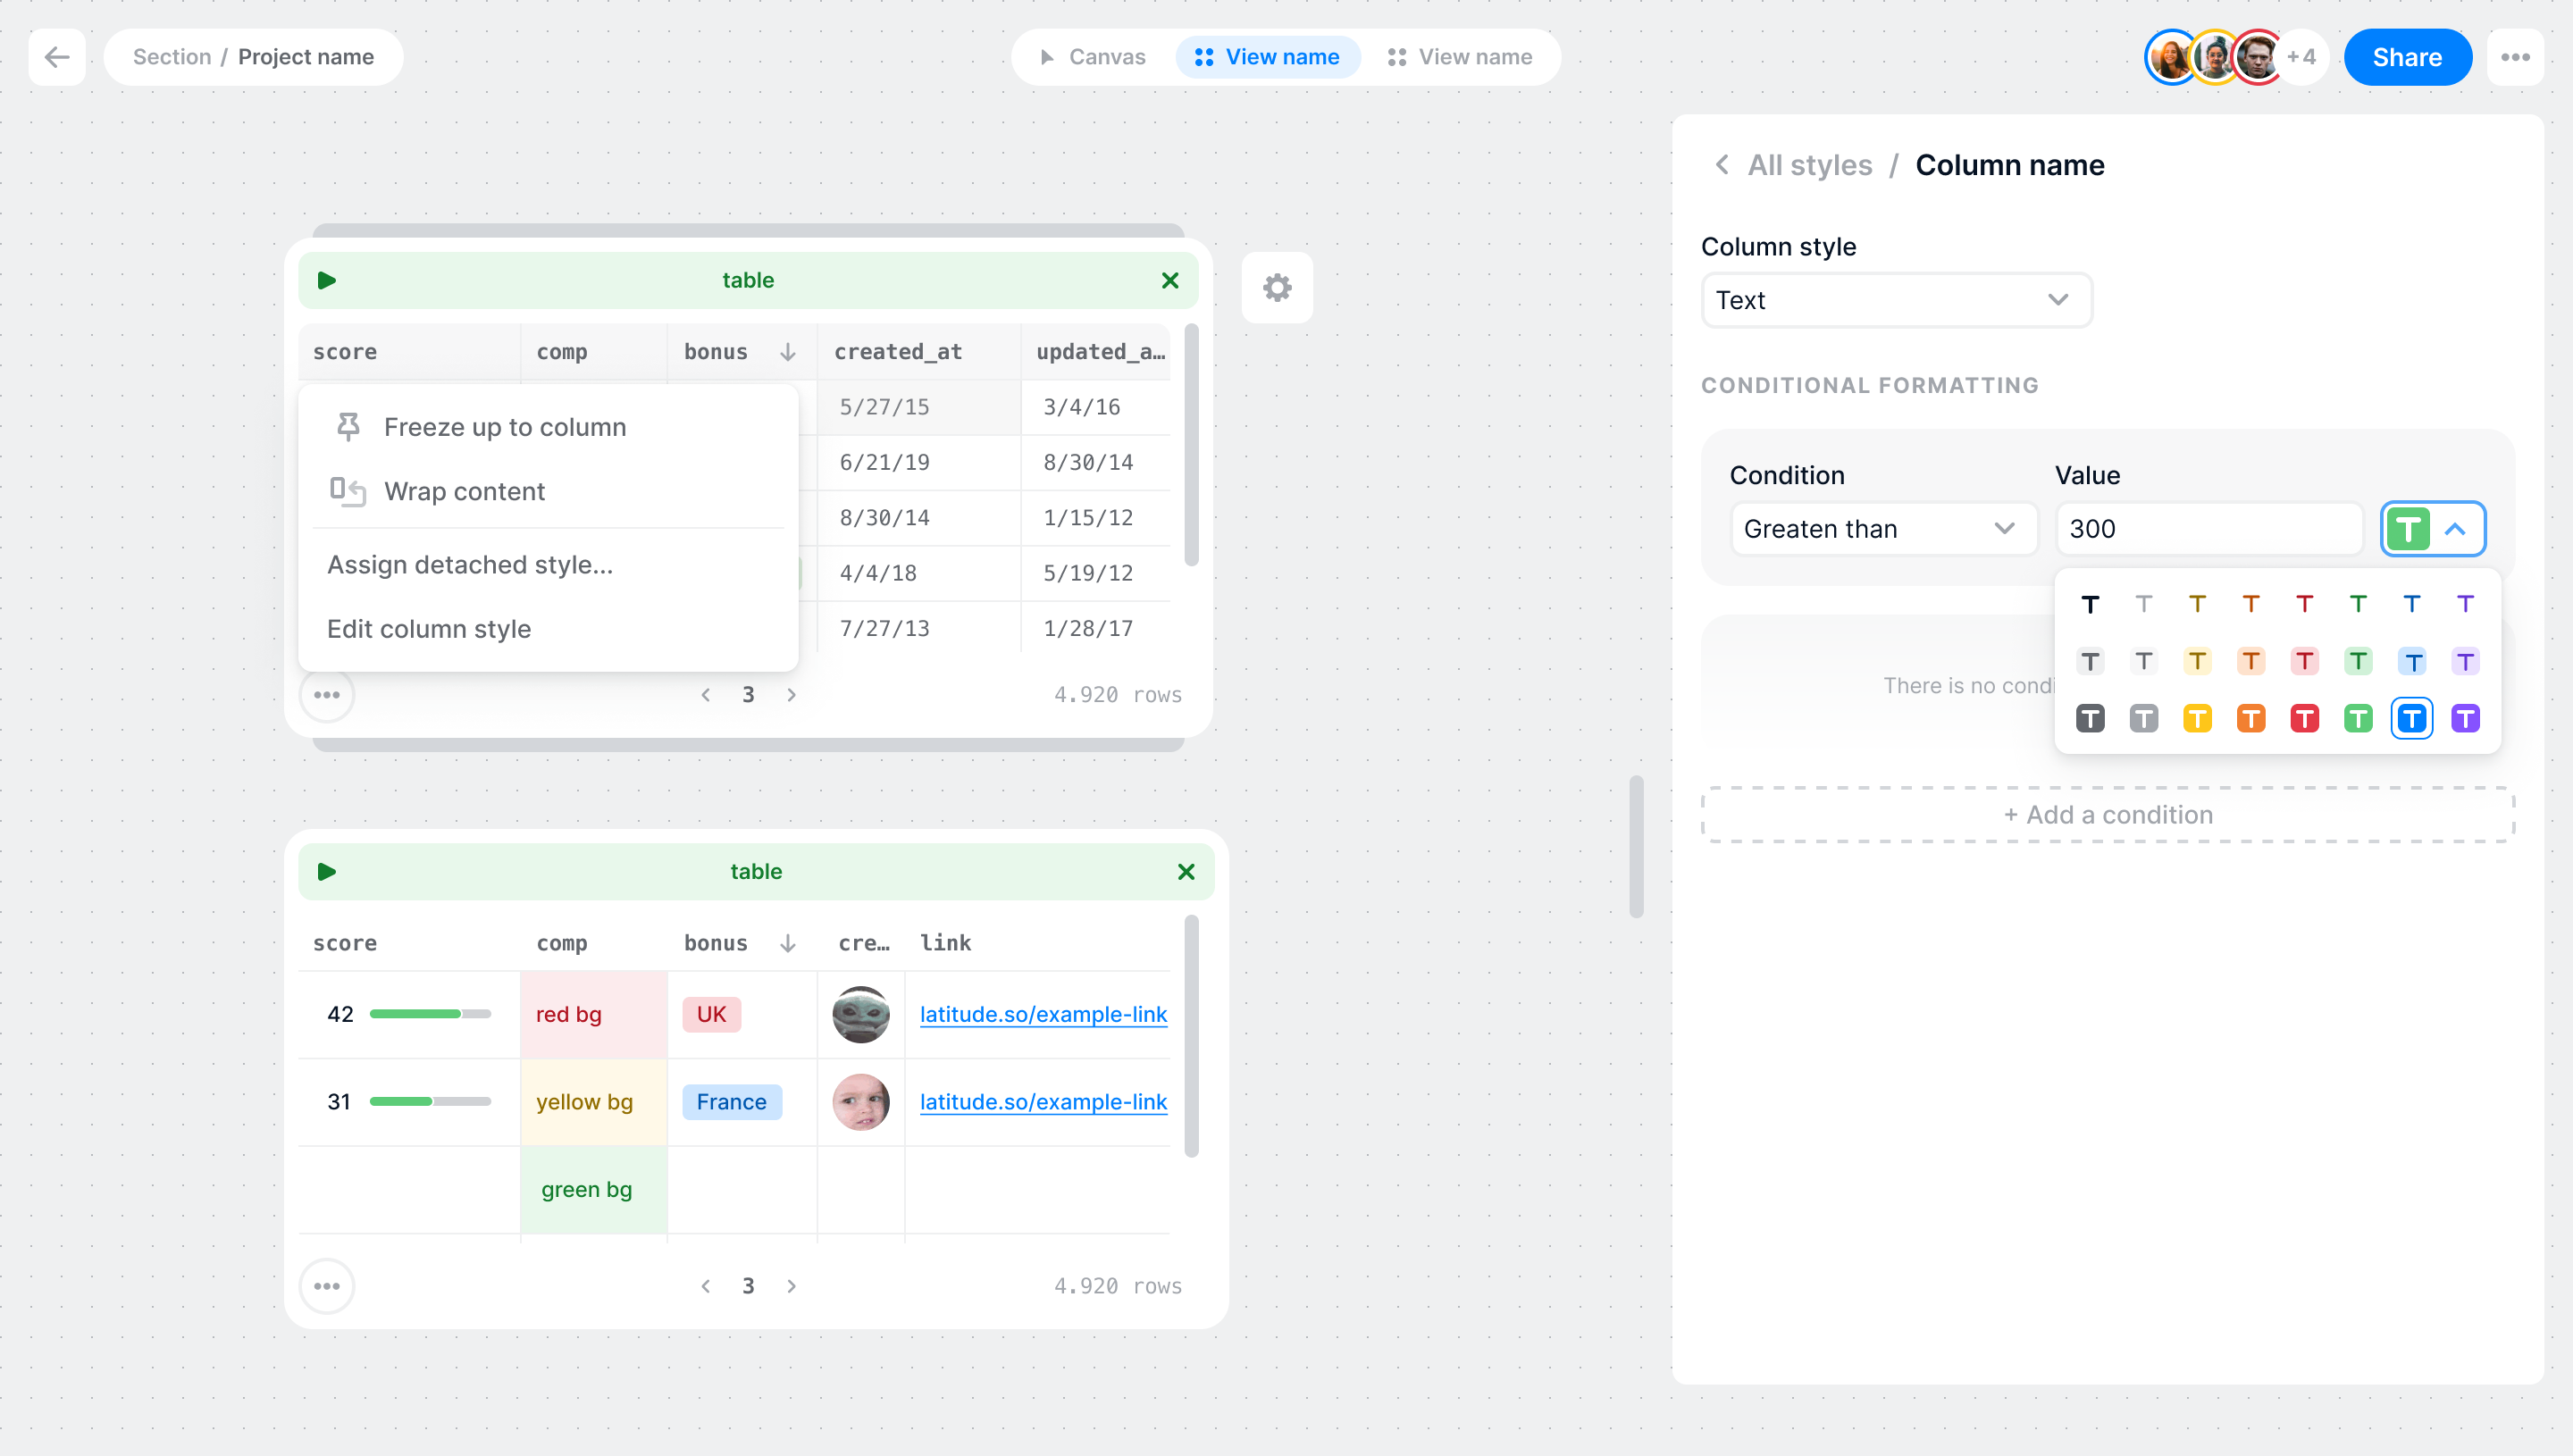
In the area of customization, we added features such as conditional formatting to our tables with the goal of offering something more than the competition, the best user experience, more understandable and easier for stakeholders.
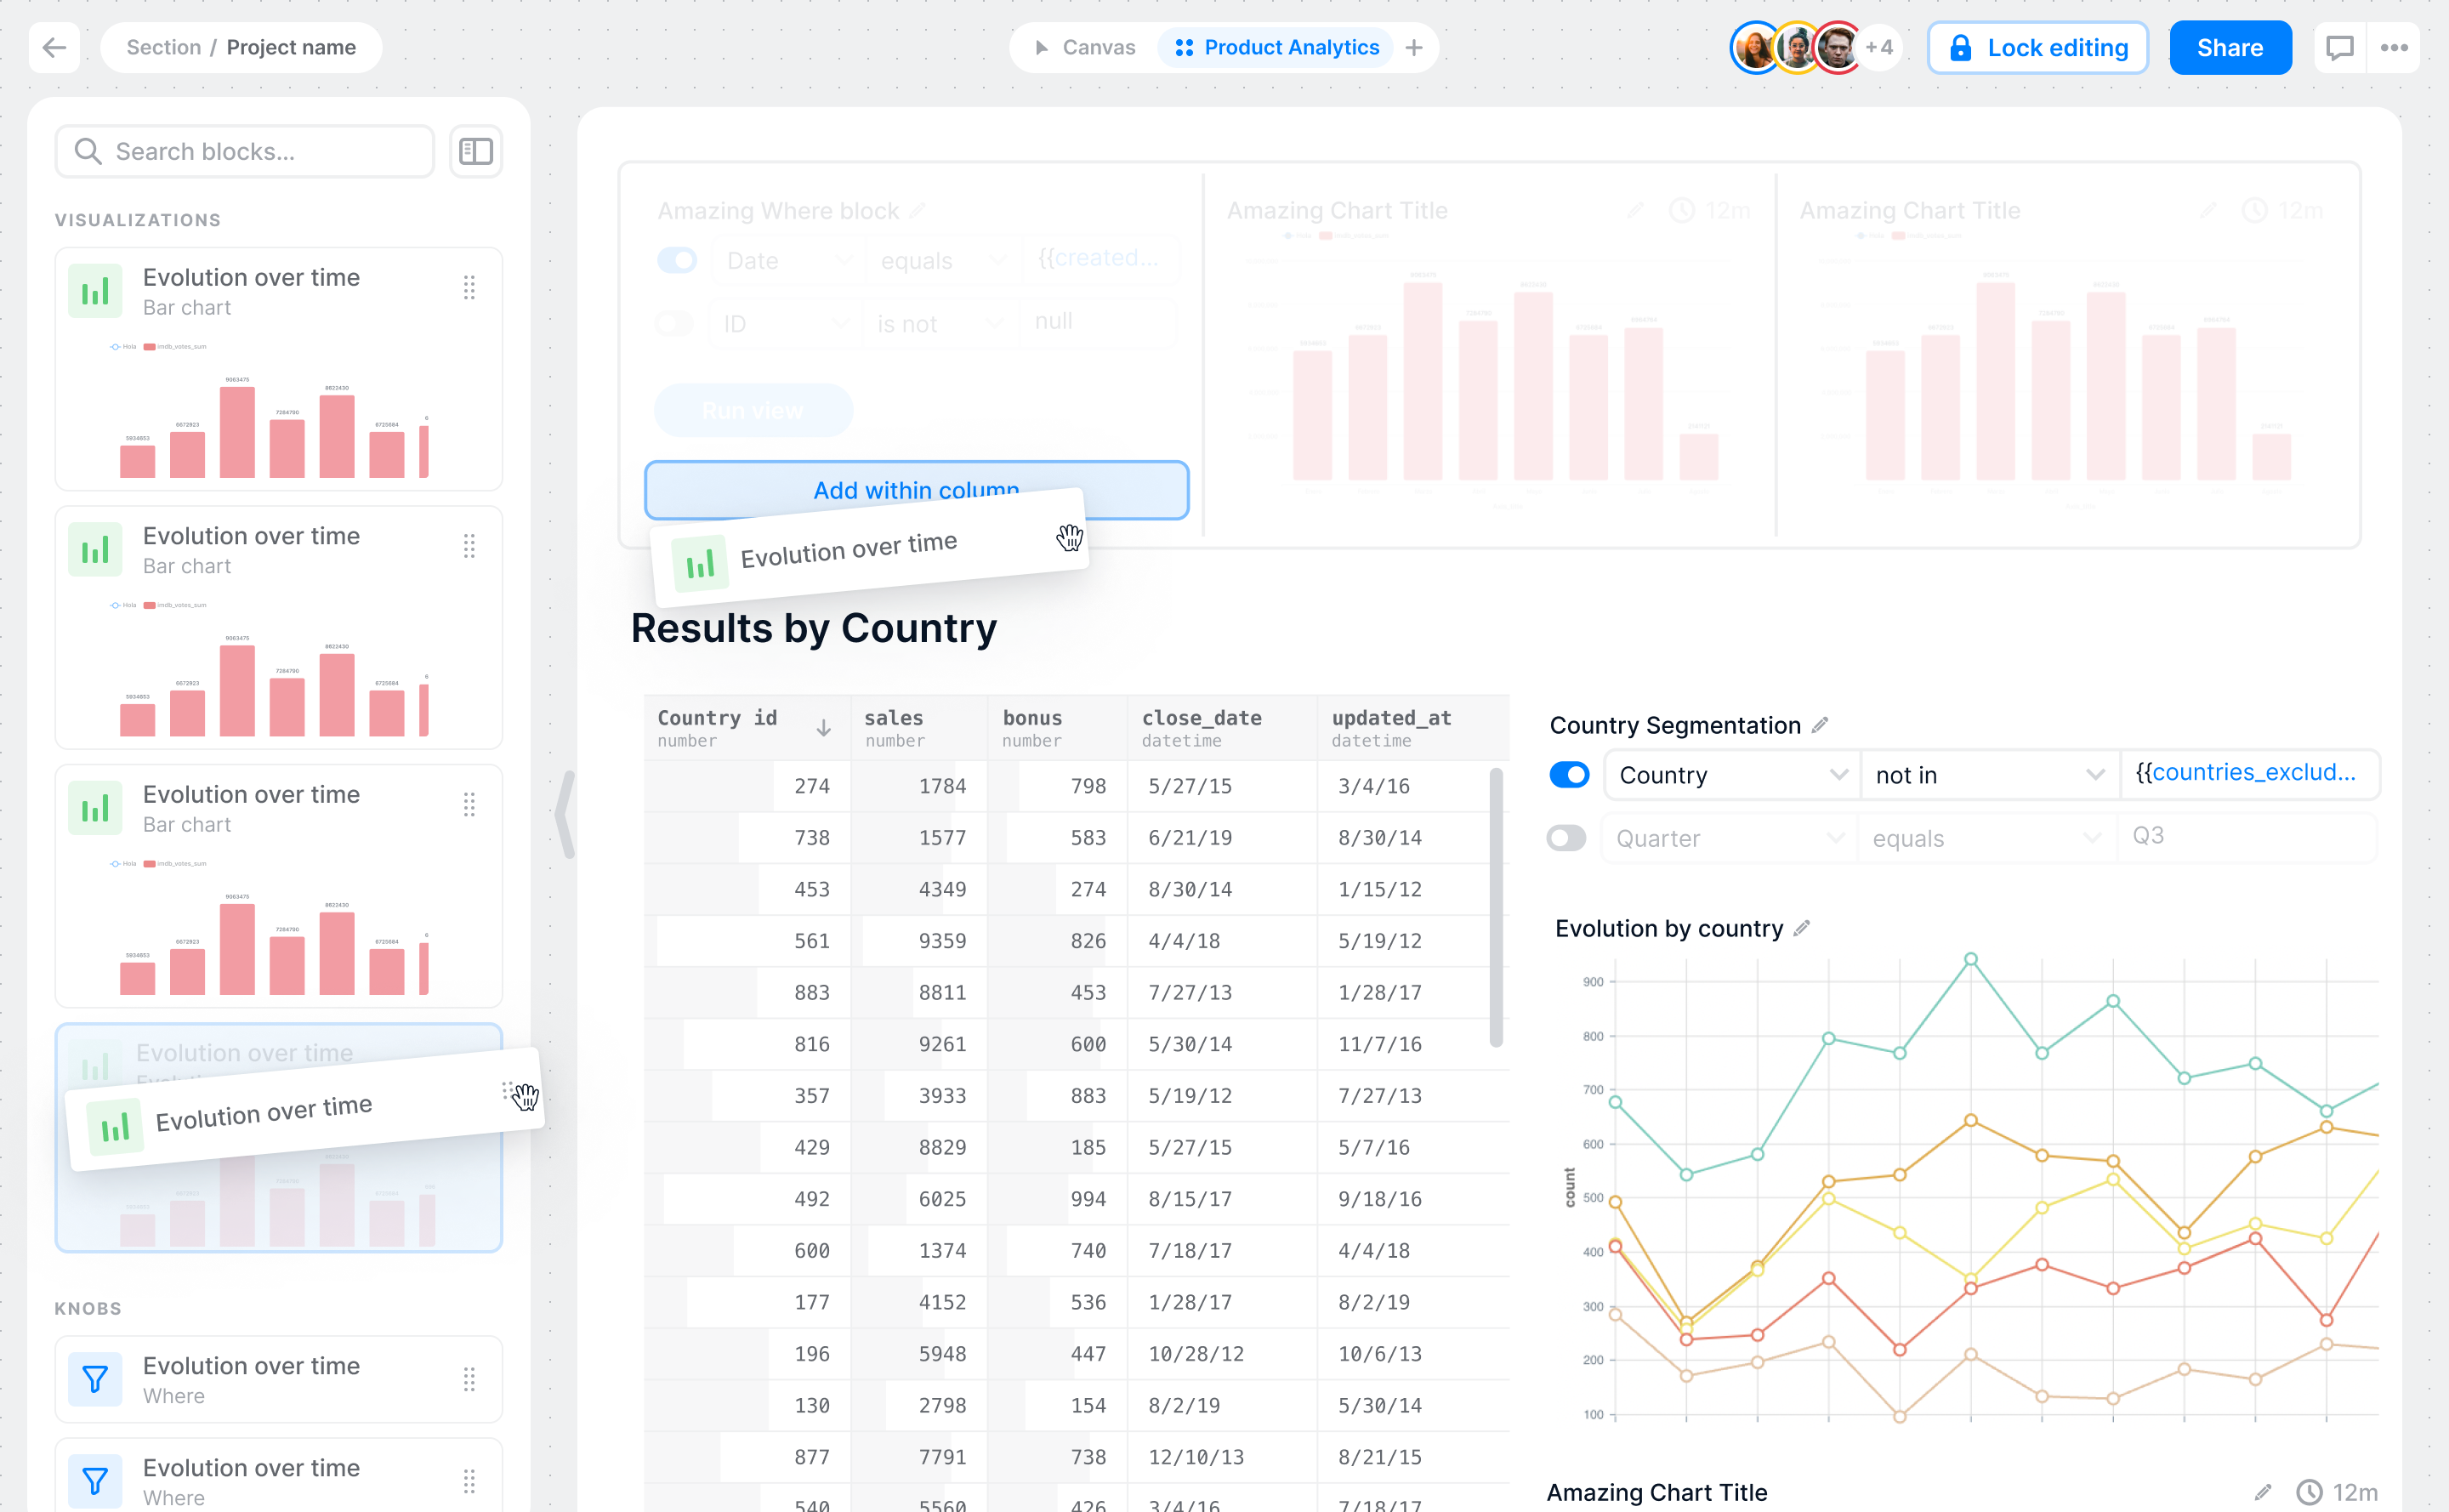
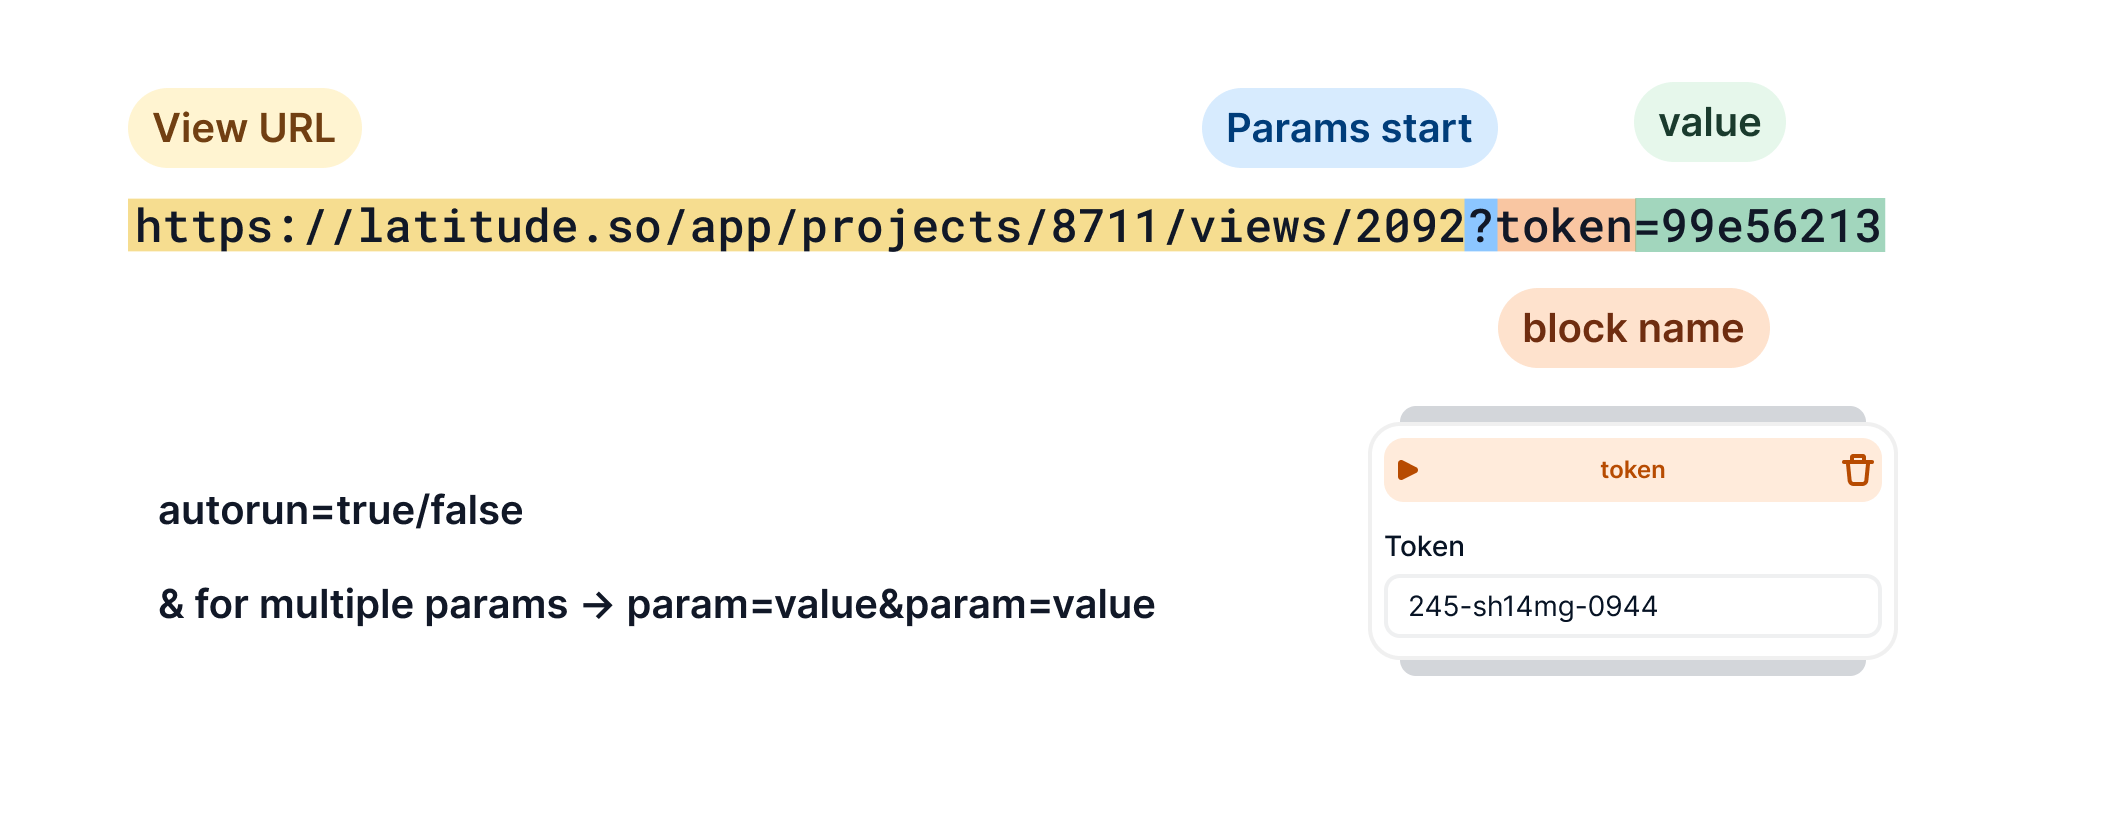
The dashboard builder changes to a drag and drop model with rows and columns that are super easy to configure. We also added external sharing with URL params to filter the same dashboard for different clients.
Key Features
New charts with a fresh UI and more customization options.
New dashboard builder with hierarchy of rows and columns. Drag and drop model.
URL parameters to filter data in the same dashboard for different clients.
Success
We converted to clients 5 users and they provided internal analytics to their users with Latitude.
The feedback from our users was positive and the number of actions to configure visualizations and dashboards was reduced.
100% of clients used the URL params to filter the same dashboard for different clients.